1
/
of
3
No reviews
Regular price
$39.99 USD
Regular price
$49.99 USD
Sale price
$39.99 USD
Taxes included.
Couldn't load pickup availability
Know exactly how your business is doing, in one screen.
Stop digging through messy spreadsheets. Enter your sales data, click Refresh All, and get a complete, interactive dashboard showing your revenue, profit, expenses, best customers, and top products.
What you'll see on your dashboard
- Total Revenue, Total Profit, Total Expenses and Net Profit
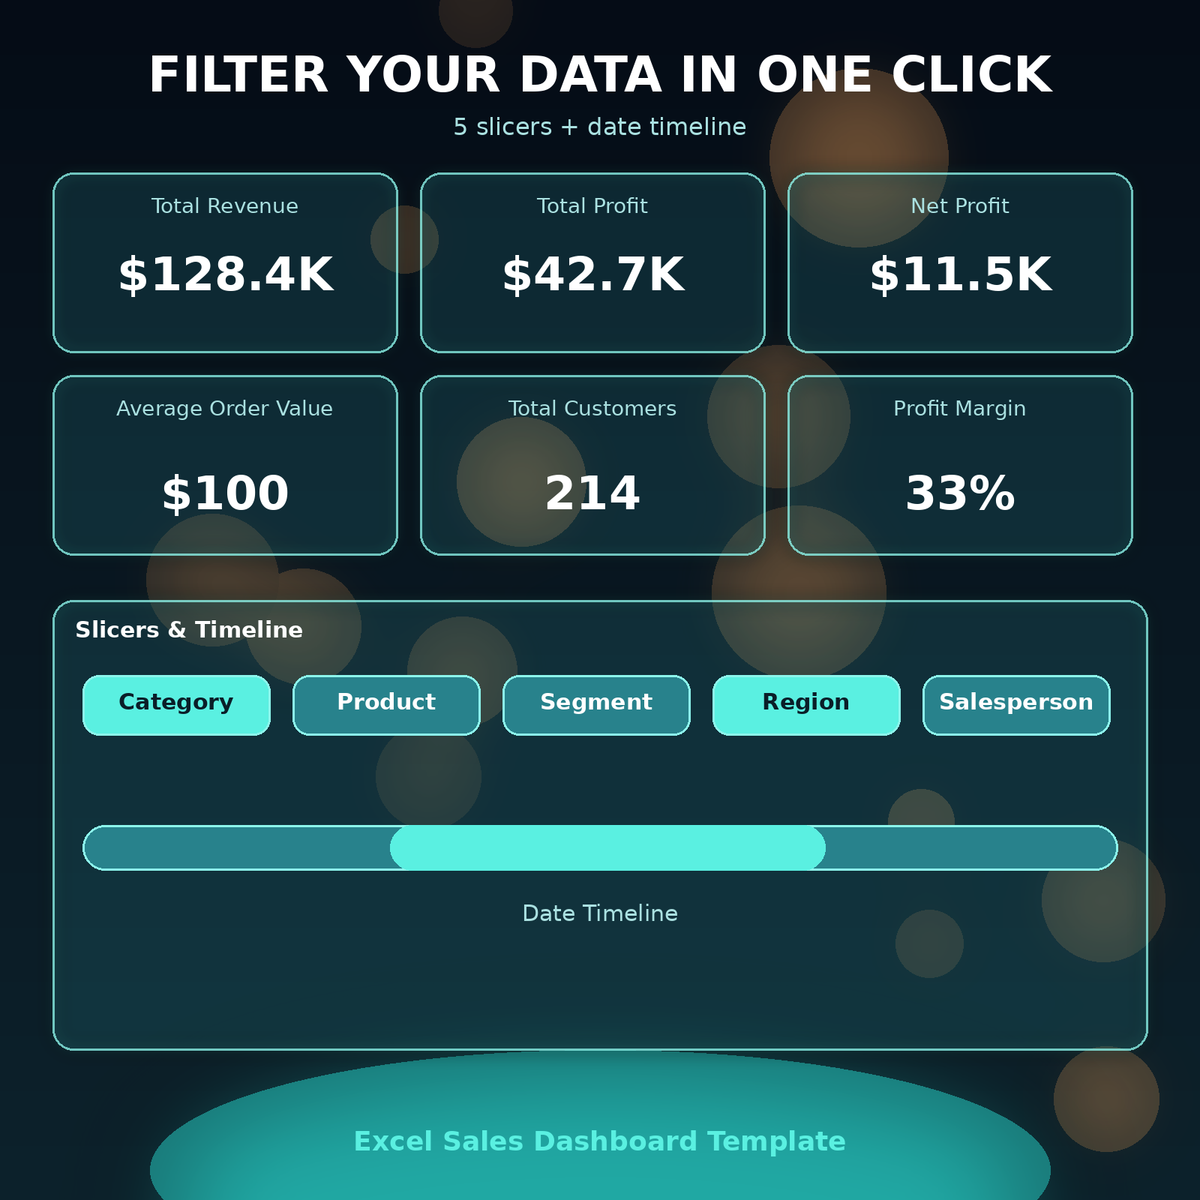
- Total Orders, Total Customers, Average Order Value and Profit Margin %
- Monthly revenue, profit, and order trends
- Revenue by product, category, region, customer, and customer segment
- Top 5 products and top customers
- Expenses by category
- Salesperson performance
Features
- 12 ready-made charts and 14 PivotTables
- 5 slicers and a date timeline to filter by product, category, segment, region, salesperson, and time period
- Revenue, cost, and profit calculate automatically
- Easy data entry in simple tables: Sales, Customers, Products, Expenses, Salespersons, and Regions
- Built to handle large amounts of sales data
- Step-by-step instructions included
How it works
- Replace the sample data with your own
- Click Data → Refresh All
- Use the slicers to explore your numbers
Perfect for
Small business owners, online sellers, shops, freelancers, sales managers, and anyone who wants clear sales insights without learning complicated tools.
Requirements
- Microsoft Excel desktop version (Windows recommended)
- Excel 2021 or Microsoft 365 required
- Not compatible with Google Sheets, Excel Online, or mobile apps
What you get
- Excel dashboard file (.xlsx), instant digital download